Great New Day Trading Scalping Strategy For Huge Profits
In this article, I will show to you how to successfully combine indicators to create a profitable day trading strategy. As you read, you will get a clear understanding as to why this new day trading scalping strategy is great.
The indicators we will be using are the 100 Exponential Moving Average (EMA), the 200 EMA, the Stochastic RSI, and the Average True Range (ATR) stop loss indicator by Edgar_Tran_Trader.
Change the EMA settings to 100 and 200 respectively. Regarding the Stochastic RSI and the ATR, leave the settings to default. You can always change the color of the lines to your personal liking. Your Tradingview chart should look like the one below (of course I have a dark background, yours might be different).

The process step by step (taking trading scalping strategies to the next level)
We will be taking our trades only as day trades on the 1 minute timeframe. All other timeframes are completely irrelevant to us. Hence, type 1 and then hit Enter. Or, click where it says 1m on the upper left corner of the Tradingview platform.
For the purpose of making things clearer, we will use a bullish example. In other words, an example where we will be buying.
Step 1. The 200 EMA
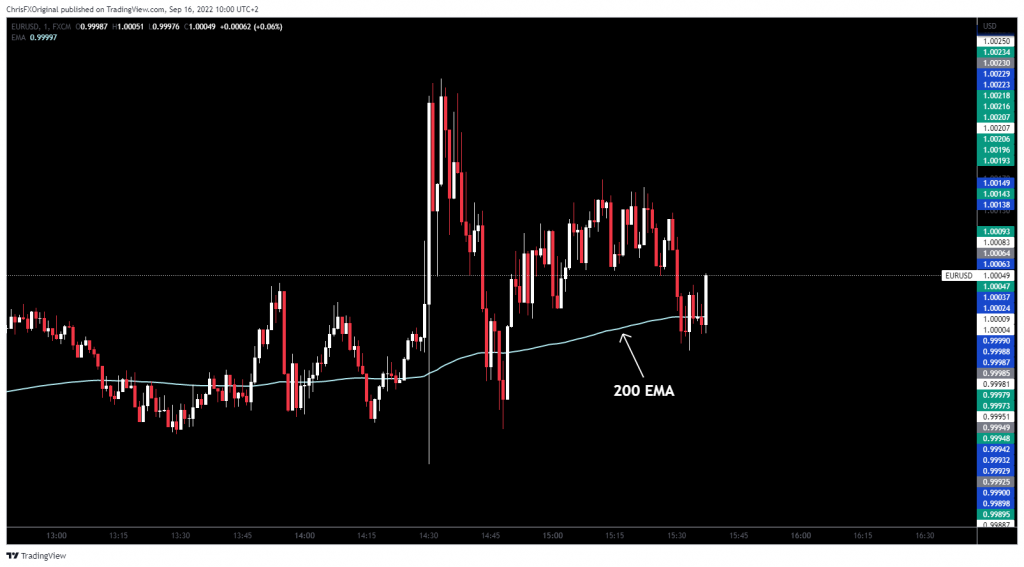
200 EMA is the blue line
We are interested only in buying when price of the 1 minute timeframe is moving above the 200 EMA. We are interested in sells when price is moving below the 200 EMA.
In the current example, price is moving above the 200 EMA or it is crossing slightly to the downside and then it’s coming back above it. Hence, we are interested in buying.
Step 2. The 100 EMA and price retracement
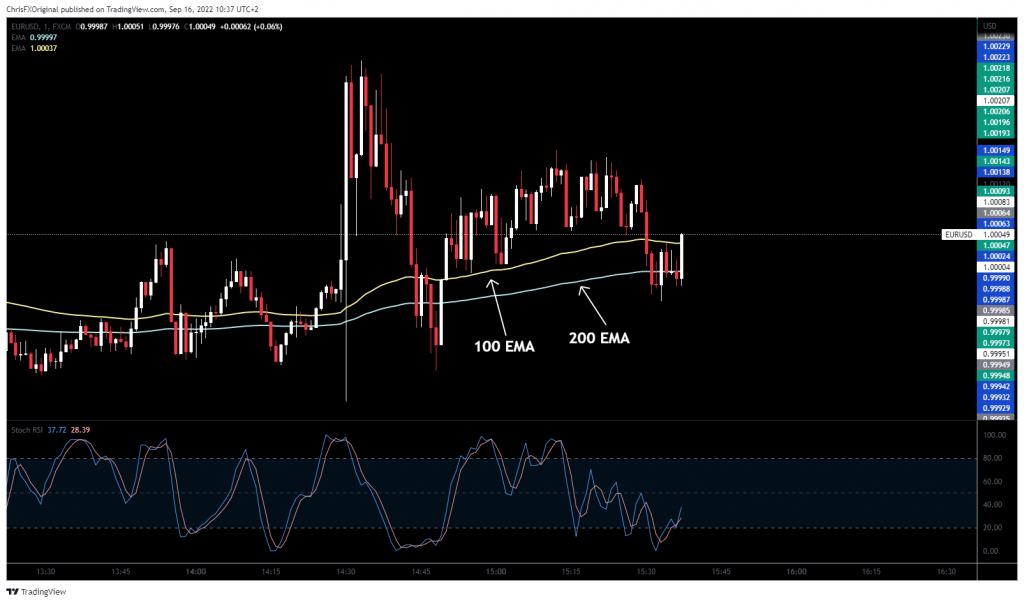
Price has at least come back and retraced to the 100 EMA, as indicated by the yellow line in our chart. This is a very important step to bear in mind.
Furthermore, this 1 minute trading scalping strategy will not work if we do not include one of the most important indicators in my opinion. This is the Stochastic RSI.
STEP 3. Identifying regular divergence (most important part of this scalping strategy)
The RSI will play a major role, since it will be providing us with the signals for trade entries. We will use the concept of the so called regular divergence.
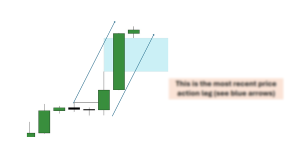
Nonetheless, we will use regular divergence in a difference way. If you take a look at the 1 minute chart above, you will notice that we are in an uptrend. We will not identify the Stochastic RSI divergence on this uptrend though, but rather in a pullback, as depicted on the image below.
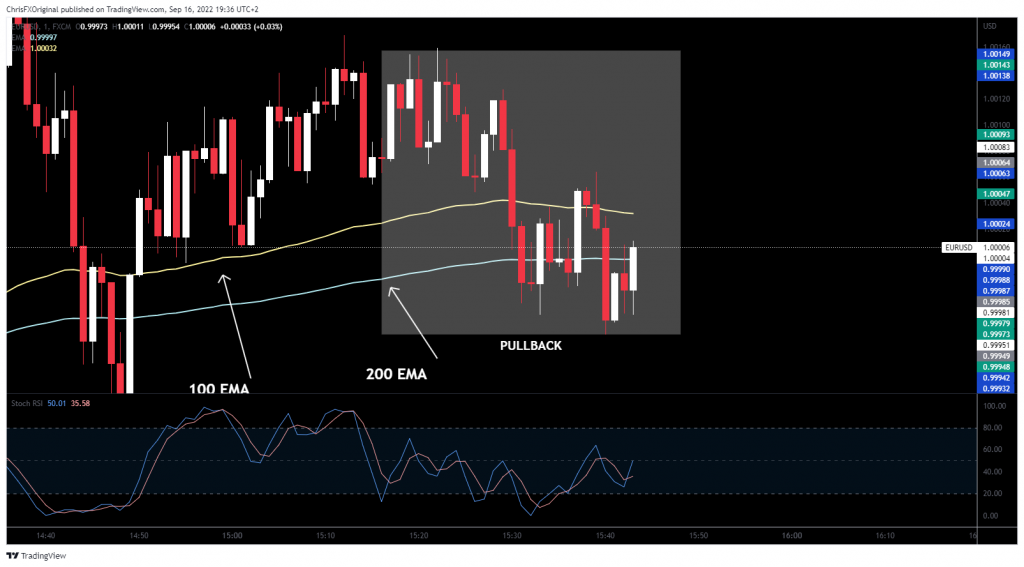
Consider that this pullback is a downtrend on a lower timeframe, such as on the 15 second or the 5s timeframes. This is where we will be identifying the RSI divergence.
What do we want to se? We want to see a lower low on the price, while at the same time a higher low on the Stochastic RSI. If you already identified it, well done. Otherwise check out the image below.
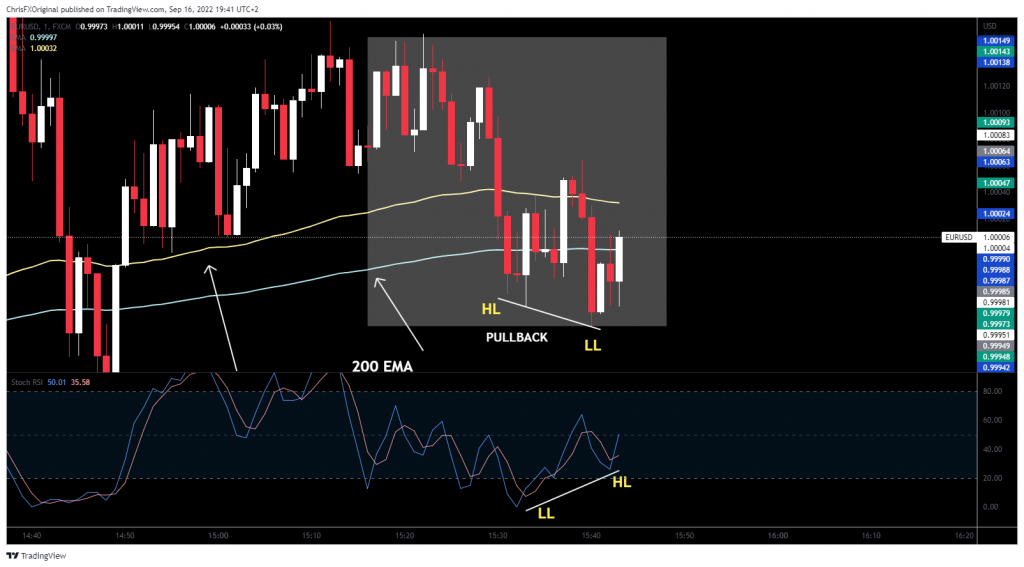
On the image above, we can see the regular divergence taking place. While price has made a lower low (LL), the Stochastic RSI has made a higher low (HL).
This is all we need to see in order to successfully enter a scalping trade on the 1 minute timeframe. But where exactly? How can we make this new day trading scalping strategy systematic enough? This is where the next step comes in to play.
Step 4. Stochastic RSI crossover (essential step for this great new trading scalping strategy)
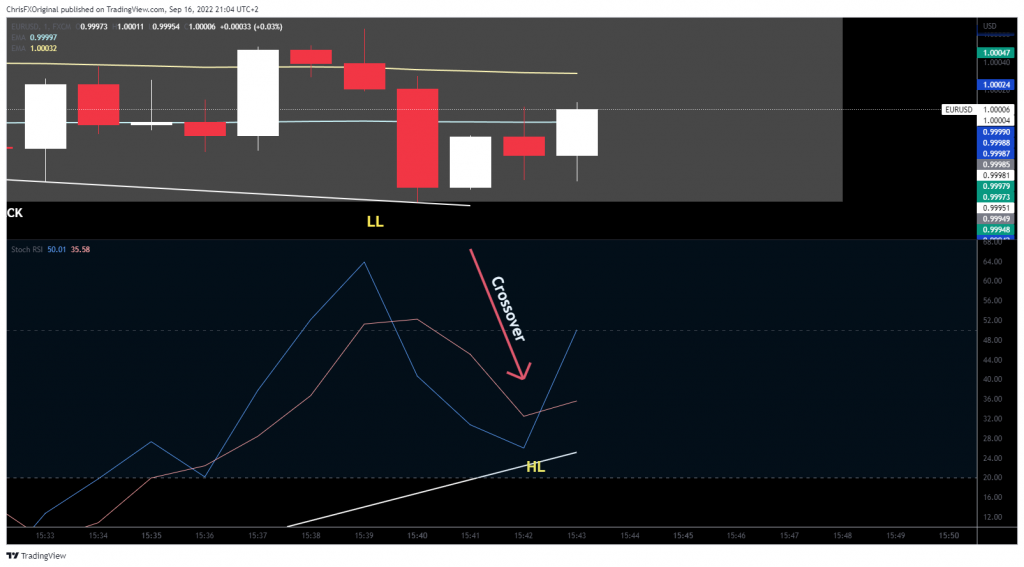
We are getting the signal by the Stochastic RSI lines crossover. When the blue line (K) crosses above the orange line (D), then we immediately place a buy with a market execution.
This new great day trading scalping strategy would not be complete if we would not answer the following questions. The first one is, where are we placing our stop-loss? And the second one is, where do we take profits? Let’s find out in steps 5.
Step 5. Stop-loss placement and take take profit
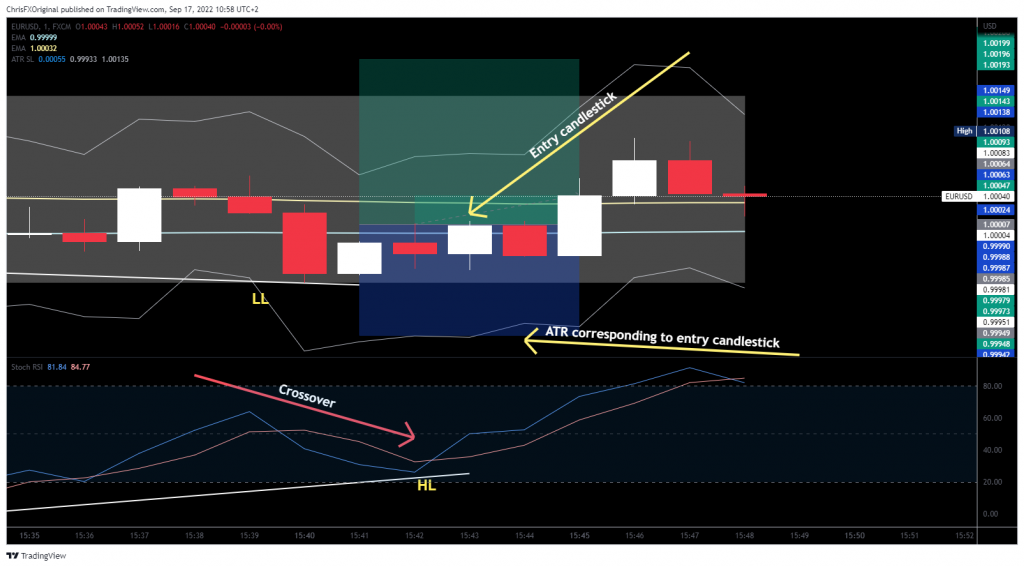
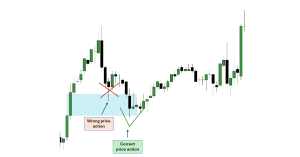
We initiate the trade (in our occasion a buy) with a market execution at the exact point where the Stochastic RSI crossover took place. This is indicated by the yellow arrow on the top.
Regarding our stop-loss placement now. We will place our stop loss at the exact spot of the ATR indicator which corresponds with the bullish candlestick that we entered the trade at. This is clearly seen by the yellow arrow at the bottom of the image.
Now, what about take profit? This scalping strategy has been tested thoroughly with different take profit targets. The best reward to risk (RR) ratio was found to be a 2/1 RR. Below you can see the statistics within a single month of back-testing.
Statistics
63 trades were taken from August 2022 until September 2022. I acquired the following statistics:
- Trades taken 63
- Wins 34 at 2/1 RR +68%
- Losses 29 -29%
- Winning percentage 53%
- Account growth +39%
Below, you can watch my video on this day trading scalping strategy:
Day trading scalping strategies can be very risky if you do not control your emotions and if you do not have a strategy which is giving you a statistical advantage.
It is normal that you will go through periods of consecutive losses and consecutive wins as well. If you want to be able to calculate those aspects of trading in advance and build a robust winning strategy, then you can check out my courses.
In the courses, I teach you elaborate winning trading strategies. Furthermore, I teach you how to build a robust trading plan, starting with the importance of statistics and trading psychology. That way, you can take your trading to the next level.
As with all trading strategies presented here on ChrisFX, if you want to test them out, do so by trading with fake money, or otherwise paper money. NEVER test one of these strategies with real money. When and if you decide to do so, you do so at your own risk and I take zero responsibility for your actions.
Enjoy 🙂