How To Identify Inducement in Forex Trading
In this article, I will show you how to identify inducement in forex trading with the use of a great example.
First and foremost, the analysis is going to take place on the Tradingview platform as always. It is by far the most efficient platform to work on.
How To Identify Inducement In Forex Trading Step-By-Step
Remember, price is being controlled by very complex algorithms. Hence, we will try to tell ourselves a story similar to what we would do if “we were the algorithm”. I will now take you through the process of identifying inducement in Forex Trading step-by-step.
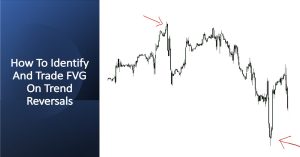
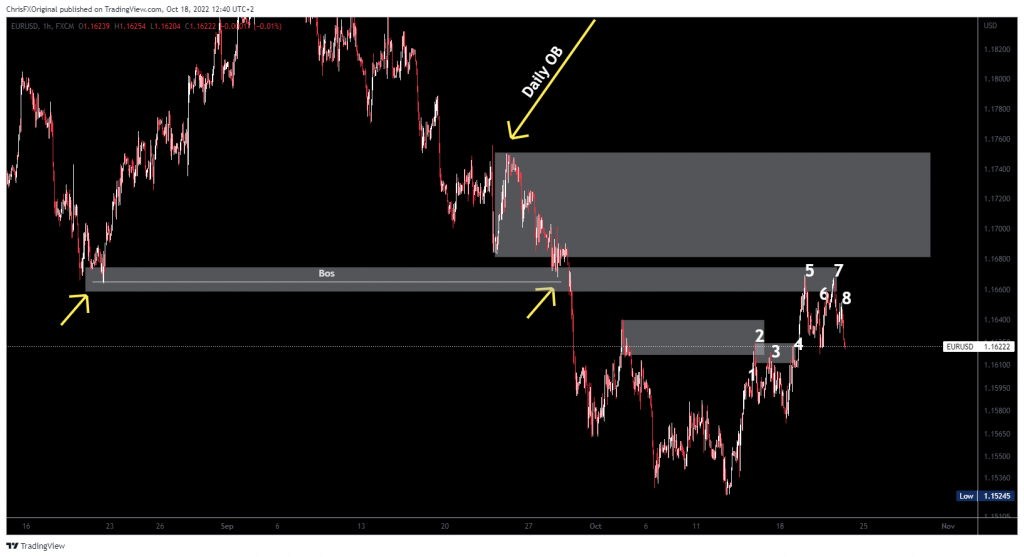
Step 1. Go To The Daily Timeframe And Identify A Break Of Structure (BOS)
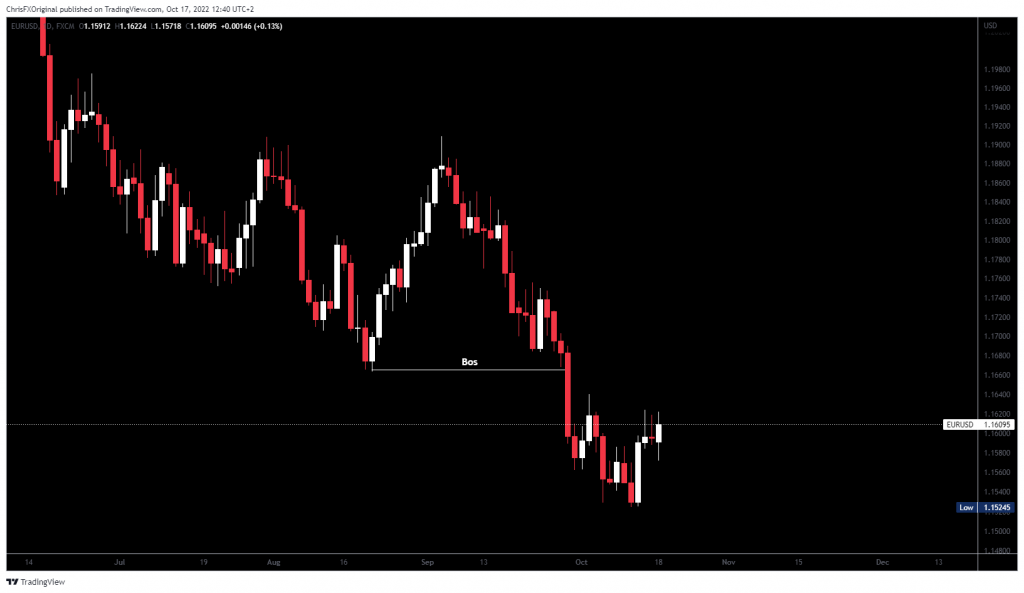
On the image above, we see a BOS on The Daily time-frame. This is an important first step in order to be able to tell ourselves the story and identify inducement in forex trading.
If you do not identify such BOS in one currency pair, you can always go and check out a different currency pair, or even Crypto. It works on all currency pairs, so there is no need to worry.
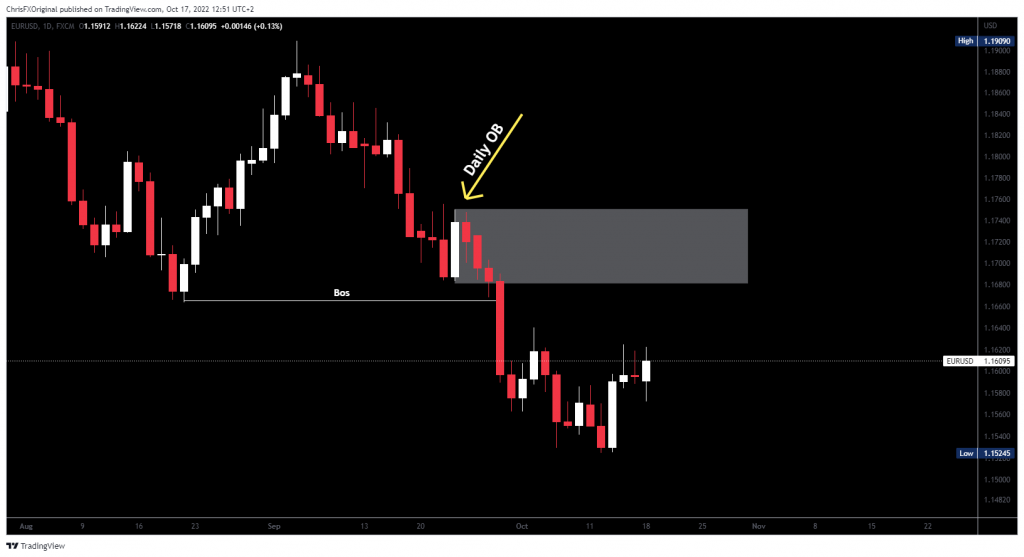
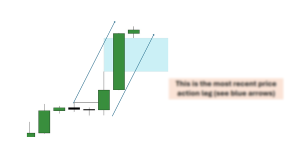
Now, we highlight the most recent Order Block (OB) on the Daily Timeframe. We expect price to retrace and retest at least this level. If not, we will identify other OBs above this area.
Step 2. Identify Inducement In Forex Trading By Telling A Story On The 1 Hour Time Frame
Inducement 1
We are now on the 1 hour time frame and we will tell ourselves a story until price reaches the 1D Order Block area that we talked about beforehand.
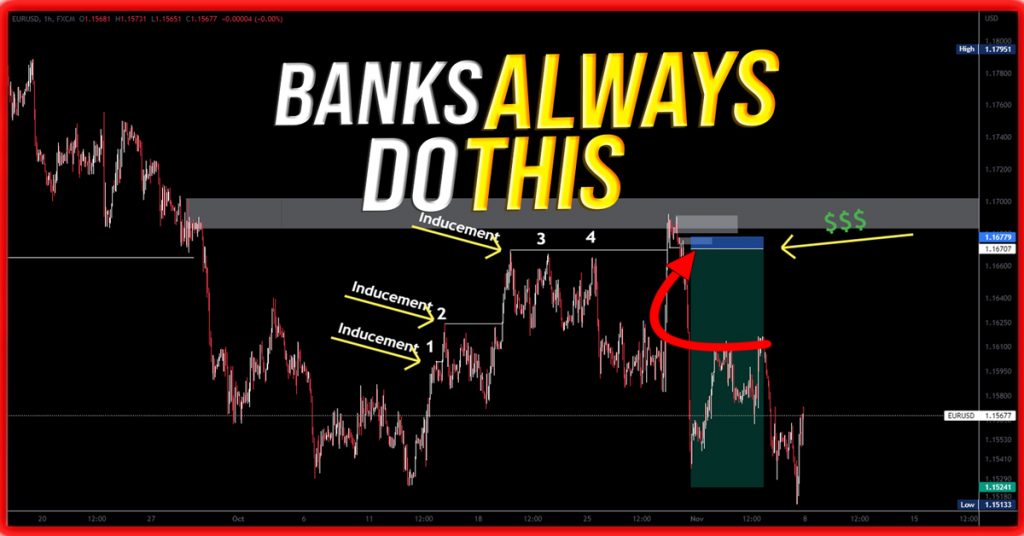
You can identify the first inducement. As you can see on the image above, many support and resistance traders would have entered a trade exactly there, with a stop loss right above the resistance area. Those traders have lost and hence we we call this inducement number 1.
After each example, I will place numbers on the images so that you will know which are the points where inducement took place.
Inducement 2
Here we can see yet another resistance area. People who lost the first trade under inducement 1, now enter a new trade on this new resistance area with a stop loss right above it.
In order to keep the chart clear and easy to understand, for the moment I will not include the trades. Nonetheless, I will include all of them in the final image.
Inducements 3 And 4
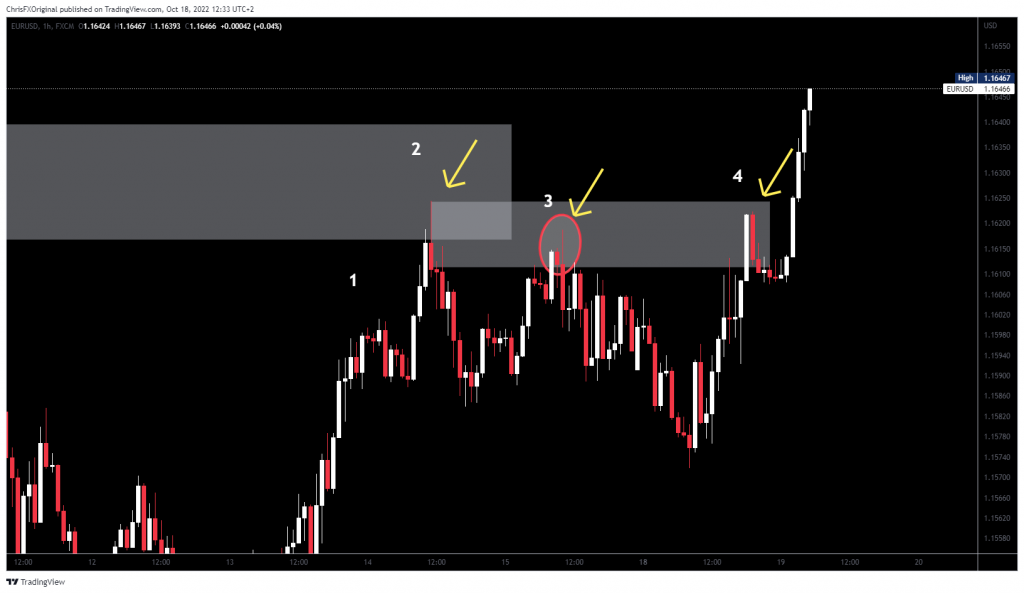
We can see more inducements taking place on the image above. Inducement number 3 has the following logic: People perceived it as a lower high compared to the one from number 2. Hence they added another trade at number 3.
In addition to that, it is easy to identify that inducement number 4 happened because support and resistance traders saw this highlighted grey area being “respected” 3 times. Hence they added another trade there. Look at what price did. Traders who entered at 2,3 and 4, are now out of their trades. Let’s move forward.
Inducements 5 And 6
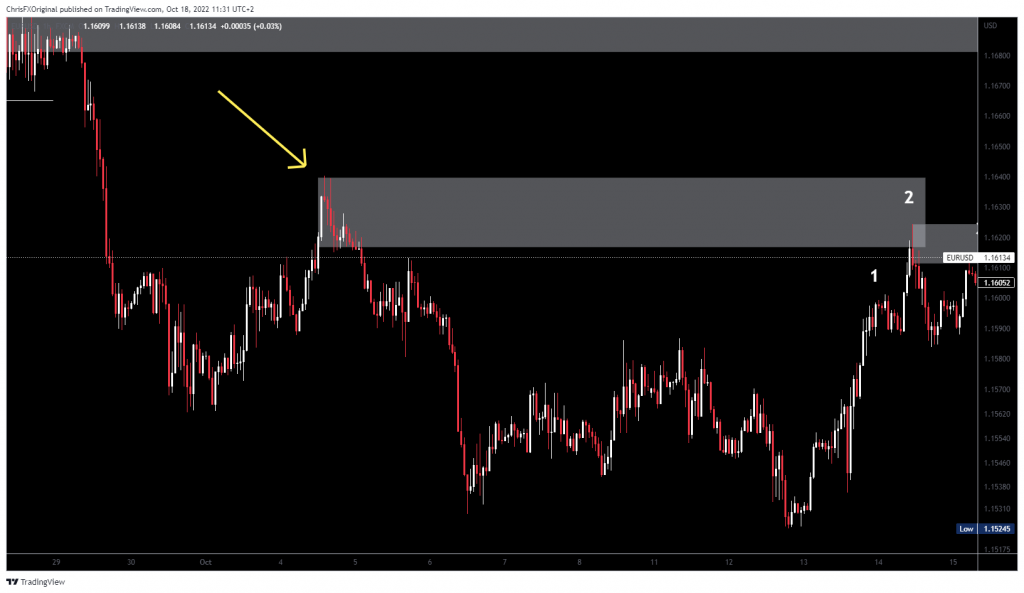
On a zoomed out chart, we can clearly see how retail traders perceived this previous support area (2 yellow arrows) as a resistance. Hence, They entered sell trades at number 5. Hopefully by now you understand that this is yet another inducement in Forex Trading and you can start identifying it easier. Let’s take a closer look.

Not only traders enter on number 5 because of this previous “support now becoimg resistance”, they also perceived number 6 as a lower high. Hence, either they entered an other trade at number 6, or those who did not manage to enter at number 5 just entered their first trade at number 6.
Now that you identify how manipulation and inducement is taking place in Forex Trading, you will see how it will all make sense in the bigger picture. Just keep reading and remain focused.
Inducements 7, 8 And 9
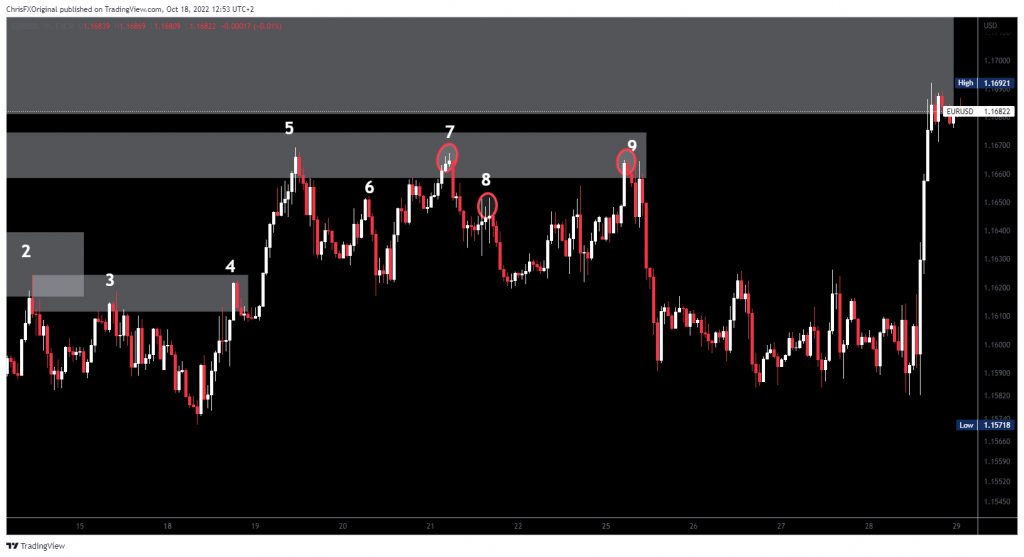
Now, let’s identify inducements 7,8 and 9. These patterns always happen in Forex Trading and after this article you will be able to identify them as well.
Retail traders entered short trades at number 7, since they saw it as a resistance area from number 5. Furthermore, they entered short trades at number 8 since they saw it as a lower high compared to number 7. Hence, they thought that either they would enter now, or it would be too late.
Number 9 needs no further explanation. It was perceived as part of the same resistance area as number 7 and 5.
Just look at how all of those traders were manipulated out of their positions. The concept of inducement took place 9 times until here. And we did not count potential inducement which for sure took place on lower time frames.
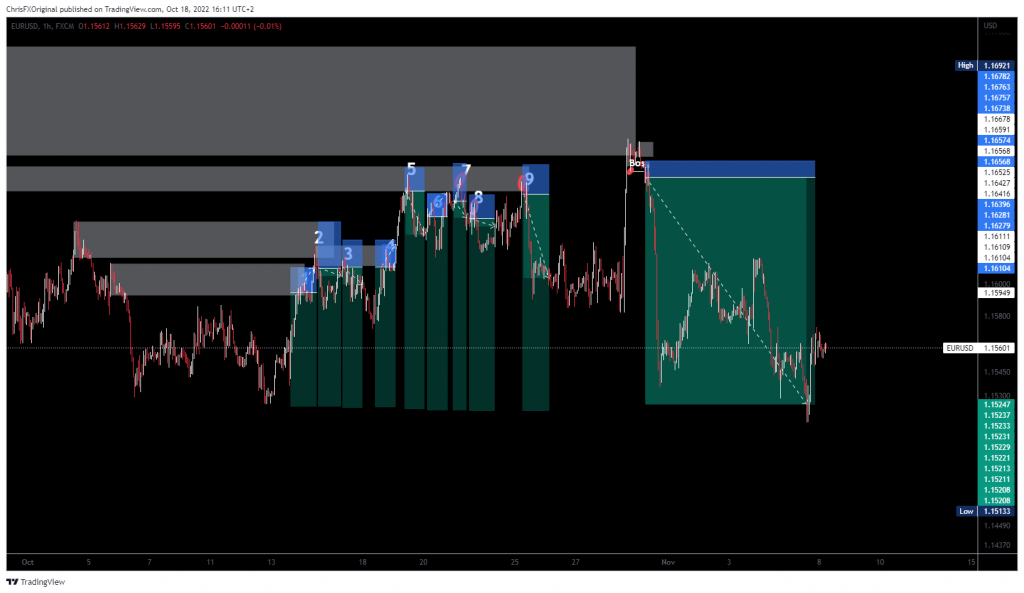
Inducements With Trades Added On The Chart

This is how all of the losing trades look like if we put them on our chart. Retail traders were induced to place trades on all of these points and they were thrown out of their trades not once or twice, but 9 times!
Nonetheless, we as smart money traders, understand that now price has reached a Daily Orderblock (OB) area. It is the thick grey line on top of the image. We have already told ourselves a great story regarding all of those manipulations that took place.
Hence, it is about time to enter trades on the winning side. How will we do that?
Step 3. The “Real” Trading Begins When Price Makes It Back To The 1D OB

This is how it all looks when we zoom out. Again, as a small reminder, we are on the 1H time-frame, and now price has made it back to the 1D OB. This is exactly where we will look for trades. Let’s move a bit forward.

I want you to pay close attention now! We have made it to the Daily OB. Nonetheless, Price is not always going to present itself in a perfect way. Hence, we need to be focused on price action.
After all the inducements that we identified, we expect that now it is the time for the actual movement. Of course, we can never be certain about it, but we can only speculate based on the story that we have told ourselves, and on past data.
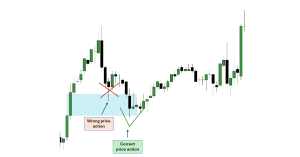
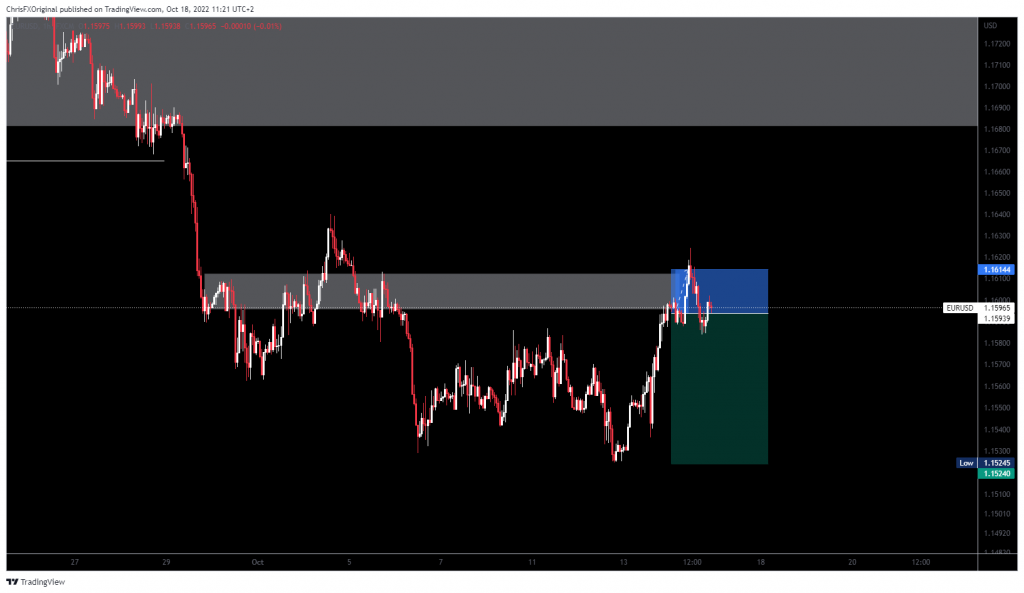
On the 1H timeframe, we see a minor BOS and hence it is about time that we instantly identify the most recent OBs. I have highlighted both OBs on the image above. I would personally go ahead and I would trade this reaction as we see it. If this one would not hold, then I would trade on the OB that I have highlighted above. But only in case that I would notice a reaction.
Step 4. Trade Entry, Stop Loss, And Take Profit Placement
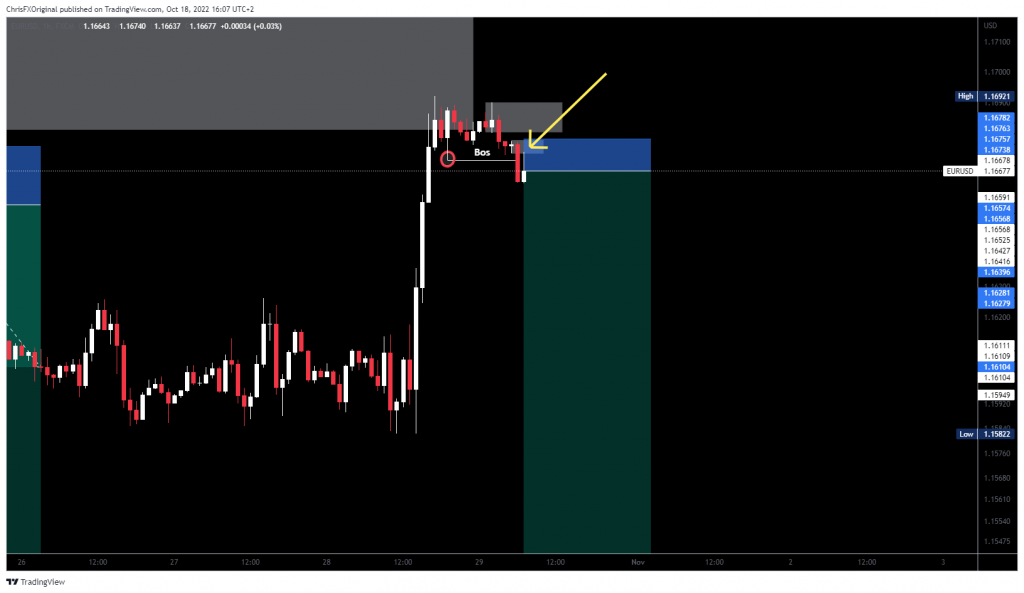
When we see the first reaction on the first 1H OB after the minor BOS has taken place, we enter a sell trade with a market execution. We place our stop loss above the 1H OB area, and we take profit on the Daily swing low. On the bigger picture it would look like that on the image below.
This is how our trade would look in the bigger picture, and we would manage to get a 13.5/1 reward to risk (RR). Not bad at all!
Now, it is important to understand that price action may induce more traders to enter and lose short trades, even within the 1D OB. The fact that we managed to win this trade does not mean that a further manipulation could not have taken place.
Always keep that in mind and do not get enthusiastic when you win a large RR trade. Remember, statistics are going to even out in the end. If a strategy has been backtested and it is giving you a certain RR, this is what you should be expecting in the long term.
Below is my video on this trading strategy:
ChrisFX Courses
Trading strategies (including this strategy on how to identify inducement in forex trading) can be very risky if you do not control your emotions and if you do not have a strategy which is giving you a statistical advantage.
It is normal that you will go through periods of consecutive losses and consecutive wins as well. If you want to be able to calculate those aspects of trading in advance and build a robust winning strategy, then you can check out my courses.
In the courses, I teach you elaborate winning trading strategies. Furthermore, I teach you how to build a robust trading plan, starting with the importance of statistics and trading psychology. That way, you can take your trading to the next level.
As with all trading strategies presented here on ChrisFX, if you want to test them out, do so by trading with fake money, or otherwise paper money. NEVER test one of these strategies with real money. When and if you decide to do so, you do so at your own risk and I take zero responsibility for your actions.
Enjoy 🙂