Learn How to Find Which Order Block is The Correct One
If you want to learn how to find which order block is the correct one, then you are in the right place. I will take you through a full step-by-step guide right now, but you can also check some of my other posts on this topic.
Once again, we will use the TradingView platform, since it is by far the best platform out there.
Find Which Order Block is The Correct One Step-By-Step
Go to the TradingView platform and press 1 and then the letter D. Then press ok. Otherwise, on the top left of your screen you should be able to see 1D. Click on that, it is the exact same thing. We are on the Daily timeframe now, where each candlestick represents a day.
You can also identify correct order blocks on lower timeframes, but on this example we will start with the Daily timeframe.
Now, I will take you through the strategy step-by-step.
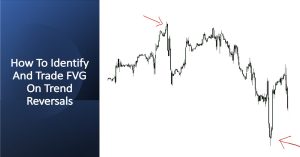
Step 1. Identify a Trend And Break of Structure (BOS)

On the image above, we can clearly see that price is breaking structure towards the downside. From now on, we will refer to break of structure as BOS.
Since we have Identified this first step, then it is time to move to the next step.
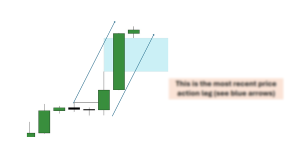
Step 2. Wait For Price to Retrace

We had a BOS, and now we have a retracement. We can clearly see price retracing, probably to re-test one of the areas in the highlighted area. So, how do we move on from here? It is very simple.
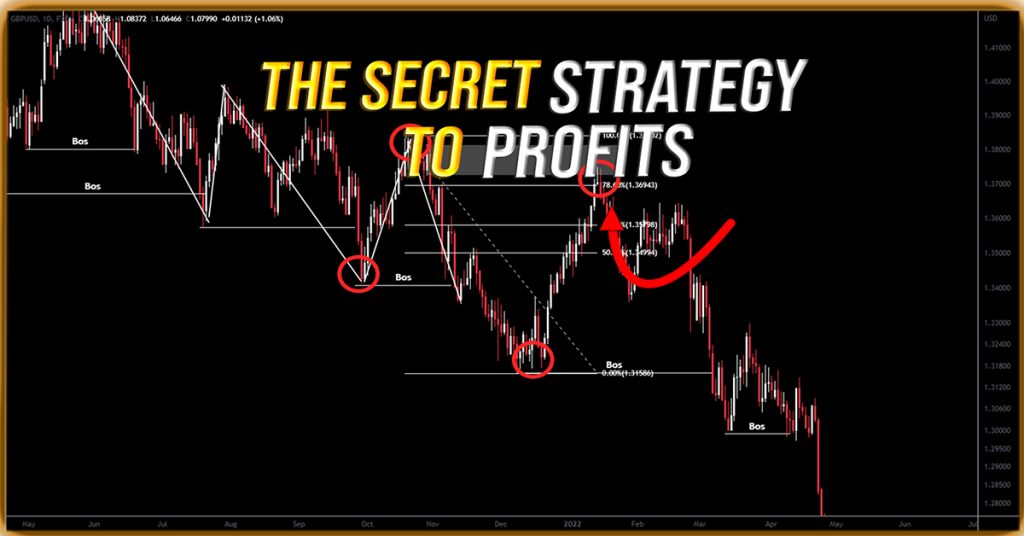
Step 3. Apply The Fibonacci Retracement Tool in Order to Find The Correct Institutional Order Block

We apply the Fibonacci Retracement tool (click here for the settings) from the top of the movement that broke price action, until the first retracement takes place.
We wait for price to reach back to the 78.6% Fibonacci level, and we only trade from Order Blocks that correspond to this level and above. Anything below this level is irrelevant to us.

I started with this example on purpose. The reason is to see that we will not always be activated into our trades. Price never retraced back to the 78.6% Fibonacci Level and hence we did not have any chance to enter a trade.
Keep in mind that we did not enter a trade, but we did not lose a trade either. This is really important. Nonetheless, as you will see in the next example we will be able to enter a great trade.

On the image above, we see how easily we found the correct institutional OB to trade from. We did that with the use of the Fibonacci Retracement tool.
We highlight the OB that corresponds to the 78.6% Fibonacci level and we extend the highlighted area to the right.
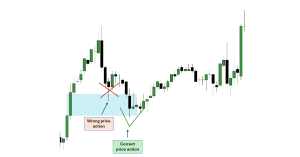
Step 4. How to Enter Trades on The Correct Order Block Area

This is an entry with a pending order at the beginning of the bearish OB (last bullish candlestick) with a stop loss above the OB area. This way, we would take a 10/1 reward to risk (RR).

Nonetheless, if we scale down to the 1 hour (1H) time-frame within the 1D OB area and wait for the first BOS, we can then enter a trade with a pending order at the 1H OB. That way we would get a 32.5% return instead of a 10% return.
Here is my video on this strategy:
ChrisFX Courses
Day trading strategies (including this strategy on how to find which order block is the correct one) can be very risky if you do not control your emotions and if you do not have a strategy which is giving you a statistical advantage.
It is normal that you will go through periods of consecutive losses and consecutive wins as well. If you want to be able to calculate those aspects of trading in advance and build a robust winning strategy, then you can check out my courses.
In the courses, I teach you elaborate winning trading strategies. Furthermore, I teach you how to build a robust trading plan, starting with the importance of statistics and trading psychology. That way, you can take your trading to the next level.
As with all trading strategies presented here on ChrisFX, if you want to test them out, do so by trading with fake money, or otherwise paper money. NEVER test one of these strategies with real money. When and if you decide to do so, you do so at your own risk and I take zero responsibility for your actions.
Enjoy 🙂